Insights
Spatial intelligence for operators, not a slide.
Every transaction is a point on the map. Use it to move a booth, brief a sponsor, or plan next year’s site.
Heatmaps
Where the money is.
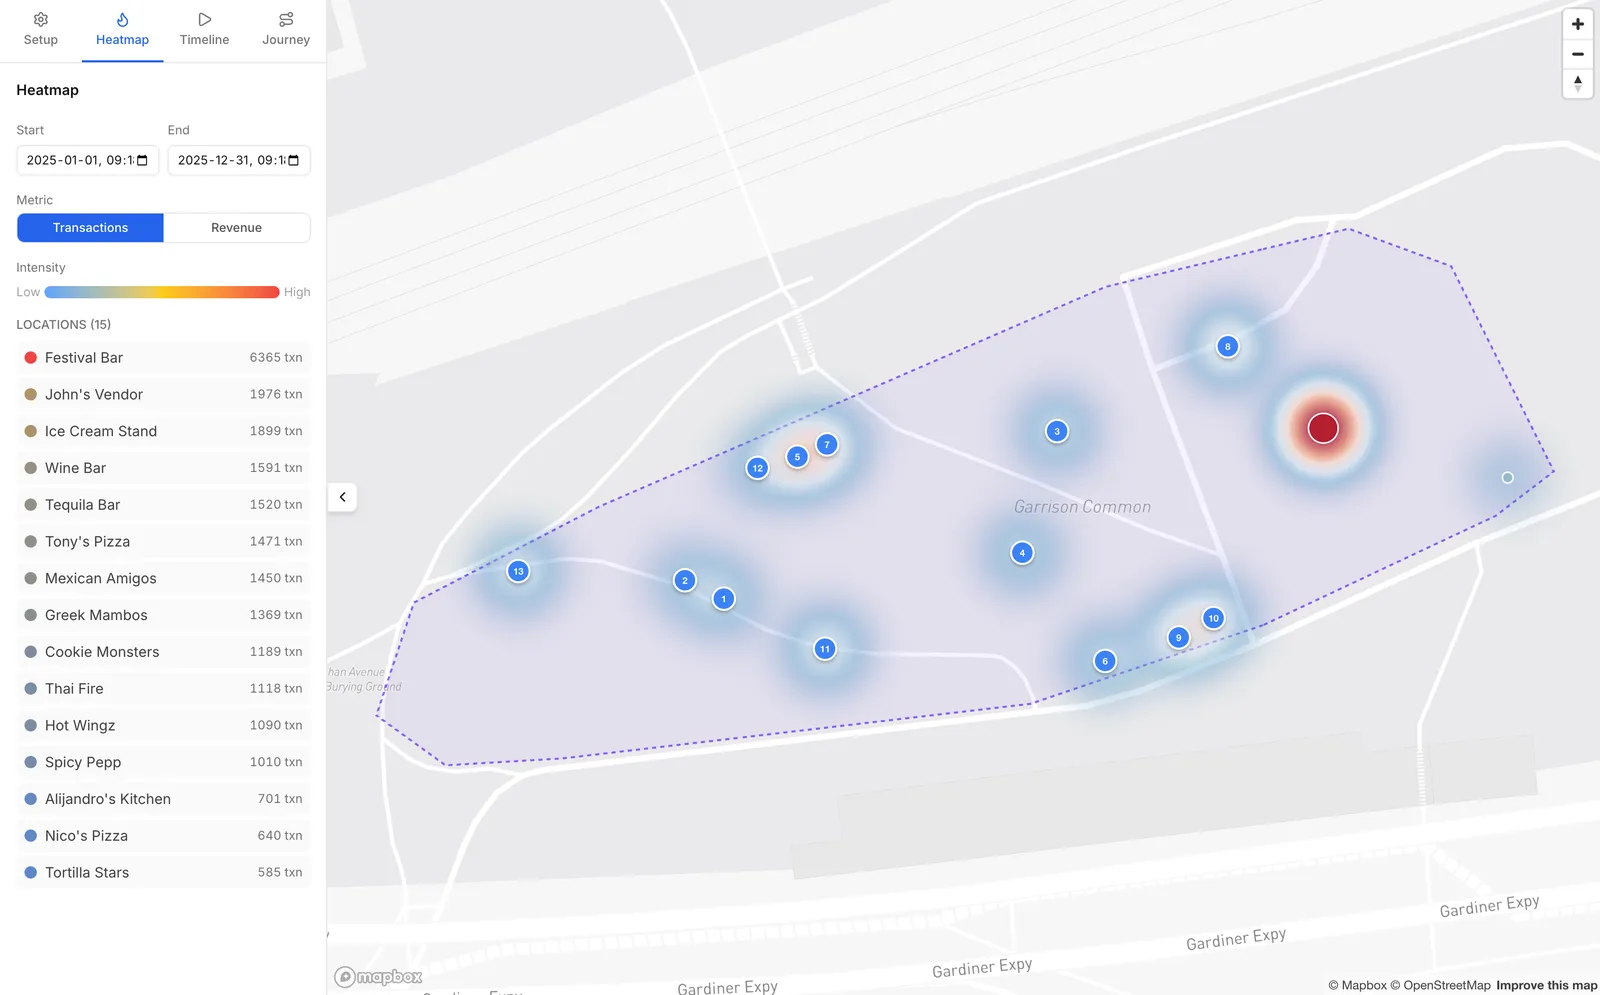
Overlay volume or revenue on the event map. Rank vendors, find dead zones, and compare days.
- Volume or revenue intensity
- Live as sales come in
- Historical ranges
Journeys
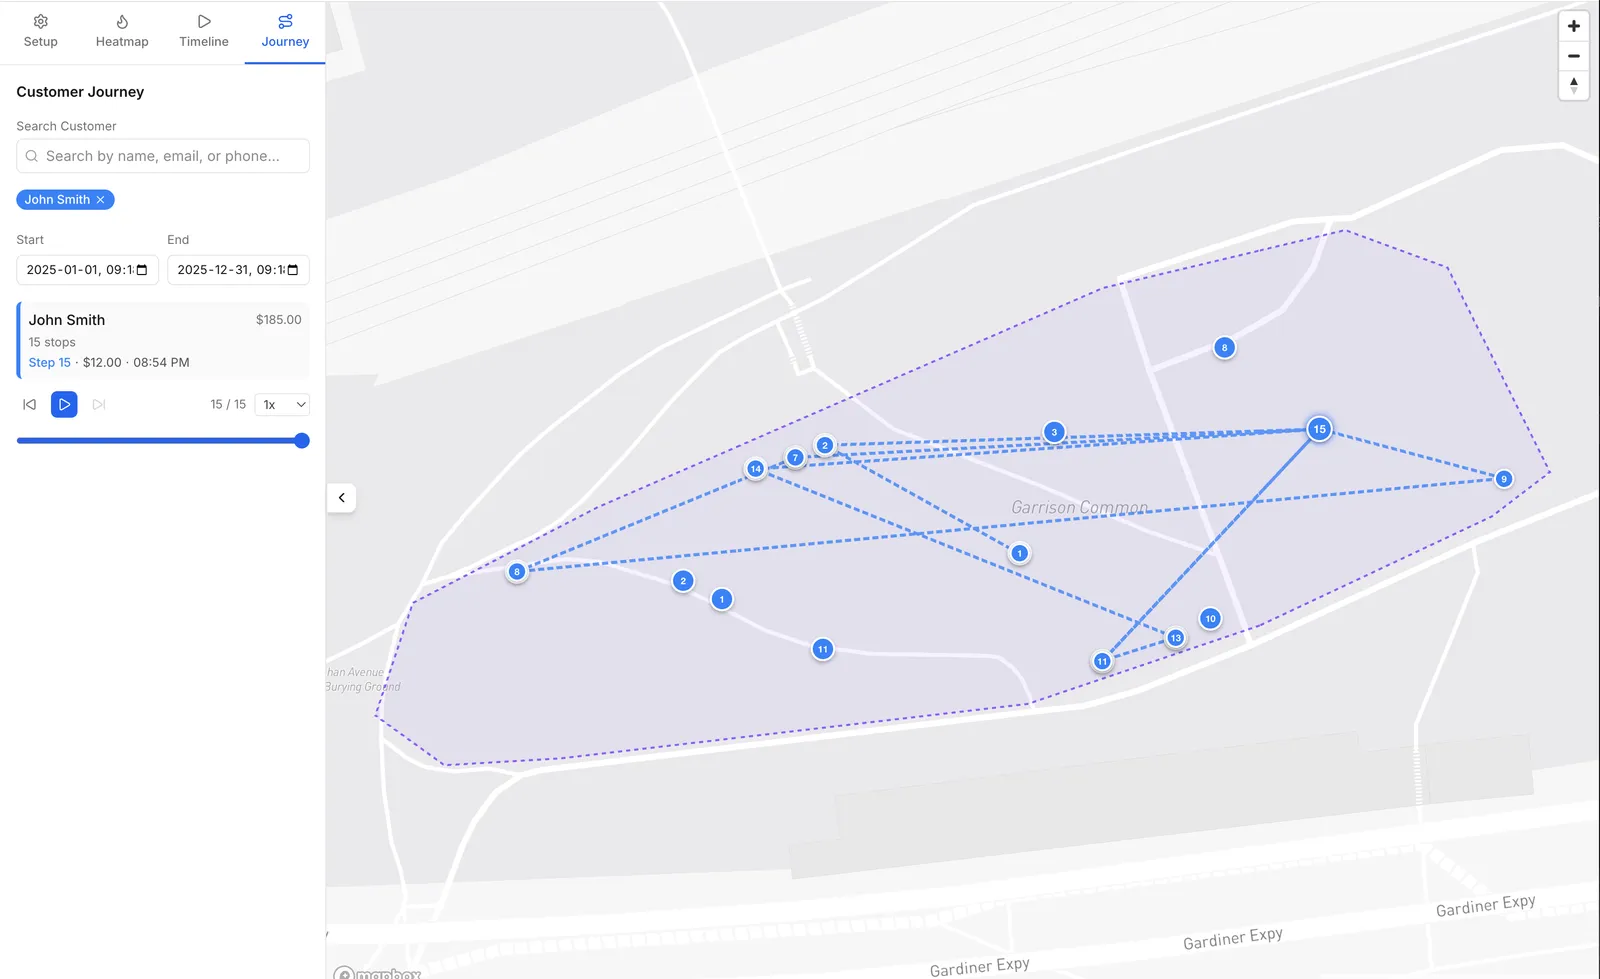
How guests actually move.
Follow a path through the site: vendors visited, spend at each stop, dwell. Useful for layout — and for proving a sponsor zone worked.
Who uses it
Organizers
Place vendors and staff against real spend, not last year’s guess.
Sponsors
Show foot traffic and engagement at branded zones with numbers, not estimates.
Vendors
See how location and hour affect the booth — useful when you return next year.
Production
Plan layouts from historical flow instead of repeating the same bottleneck.
Want to see this on your floor plan?
Bring a site map. We’ll show how transaction data lands on it.